Creating the perfect infographic can be the masterstroke of digital marketing. When you look at infographics, the first thought that goes through your mind is likely that they’re vibrant, neat to look at, and have helpful factoids. What’s likely not obvious at first glance is that infographics can be a killer vehicle for taking your marketing viral.
When you think of content going viral, you’re likely thinking of just videos or blog posts, but the perfect infographic has been known to cause a stir on the Internet, too.
What makes infographics the perfect vehicle for viral action is how they make interesting information you won’t get anywhere else available in easy-to-digest, pithy stats, along with colorful graphics and illustrations. In short, they’re the best vehicle for viral marketing because they’re perfect for the short attention spans that make up your audience across all devices today.
Creating the perfect infographic is easier (and cheaper) than you think.
An Infographic’s Anatomy
An infographic’s purpose is to both inform and entertain—that’s why it can be so popular if its design and message are on point. Since infographics don’t take up much space on the web (they don’t occupy anywhere near as much content area as a long-form blog post or take up as much of your audience’s time as an in-depth video), they’re meant to turn complex topics into something simple, easy to understand, and, as a result, fun.

And that’s where the strength of the perfect infographic comes into play.
It’s a really unique and different medium to share highly relevant information with your target audience. An infographic has the following characteristics:
- Highly attractive visuals
- A vibrant color scheme
- Is chock-full of stats and facts
- A natural reading flow
- Illustrations
- Information is presented in shorter sentences and snippets instead of entire paragraphs
- Is extremely shareworthy across social media and the rest of the web
If you understand the purpose of an infographic, that’s your first step to successfully creating your own viral infographics.
Viral Infographic Case Studies
For your inspiration, here are some notable cases of infographics almost breaking the Internet due to how many times they’ve been shared, read and linked to. These infographics demonstrate how very possible it is to create content of this nature that spread your brand image far and wide.
Customer Magnetism’s What Is an Infographic?
Try this on for size: One company decided to educate people on the web about the very basics of what an infographic is and, in so doing, managed to create an infographic…about infographics…that went viral.
CM’s What Is an Infographic webpage has already received more than 2000 inbound links (including yet another one from this blog post), hundreds of positive social signals, and, perhaps most impressive of all, nearly a whopping 100,000 page views! The page is also number one for the long-tail keyword “What is an infographic” and on the third Google search engine results page (SERP) for infographic. That brings in a ton of traffic since those are highly searched for queries.
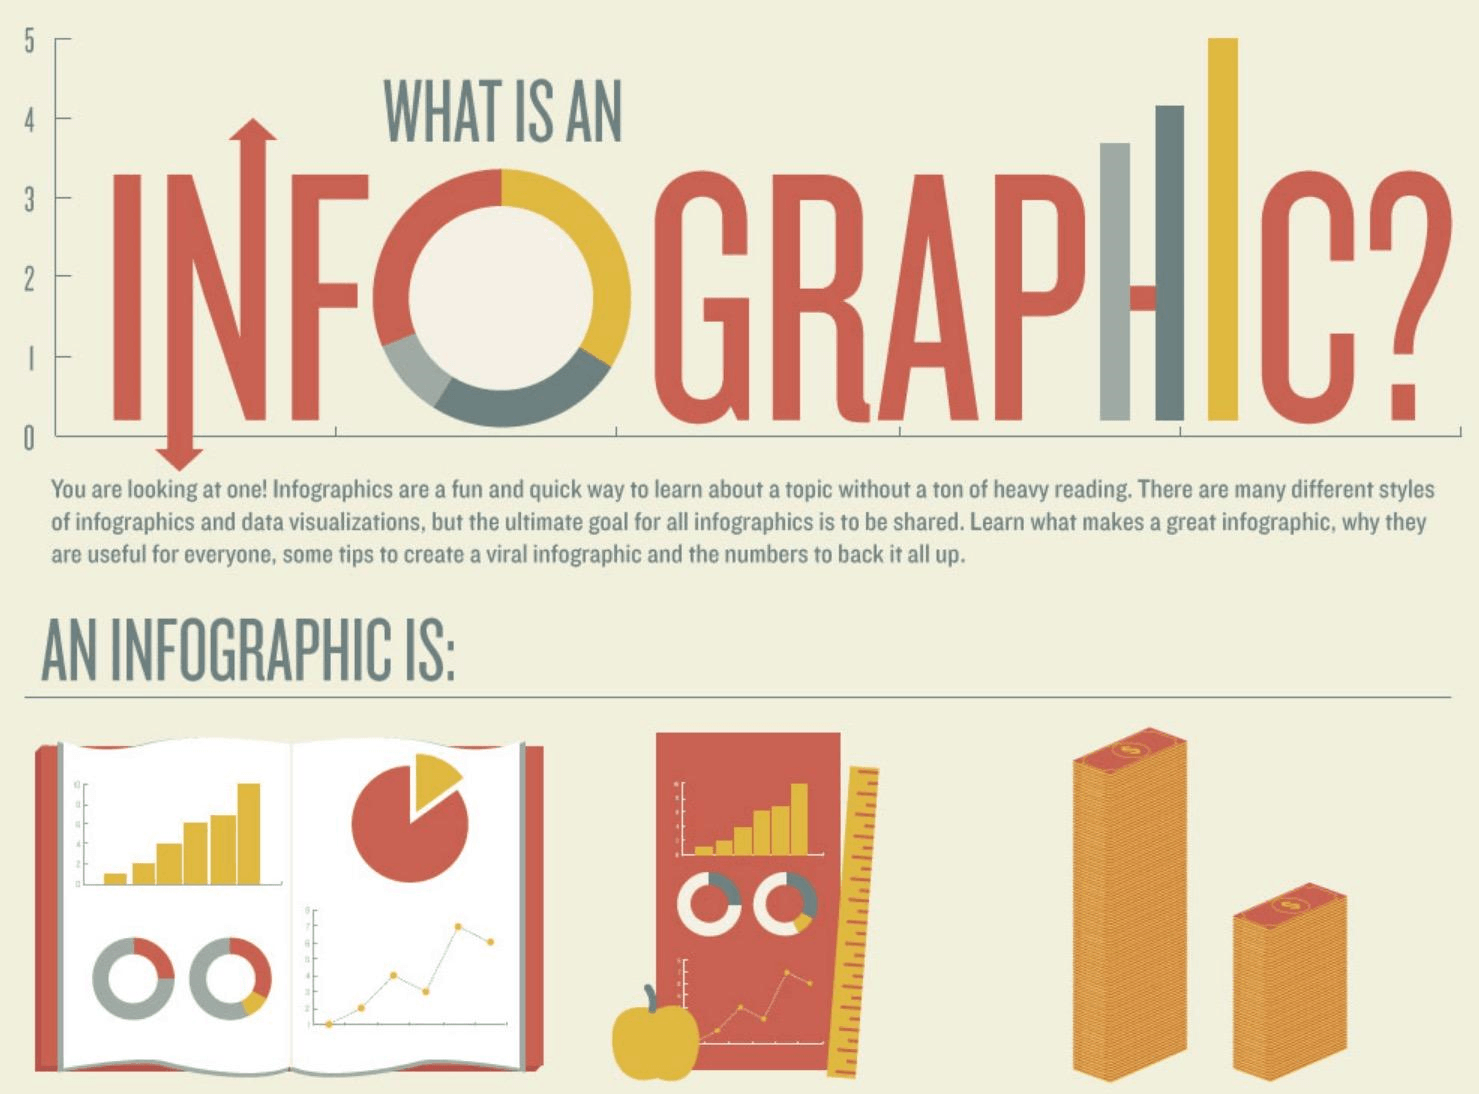
Breaking apart CM’s neat infographic, we can see the following traits:
- It educates people on a very in-demand topic
- Color contrast
- An attractive color scheme
- Surprising and helpful facts that really do inform
- Well-researched and well-sourced
The Renegade Pharmacist’s What Happens an Hour After Drinking a Can of Coke
Have you ever been suspicious about what’s really in that last can of Coke you just chugged down? Maybe you ended up feeling tired, bloated or just a bit unwell—but it was a really sweet taste, so you drank it down anyway!
It turns out that many people are indeed curious about this subject because so many of us drink soda without a second thought about what we’re really putting into our bodies. Apparently, a few years back, qualified-pharmacist-turned-holistic-advocate-and-entrepreneur, Niraj Naik, asked himself the same question. The result was this pithy infographic that took the world by storm.
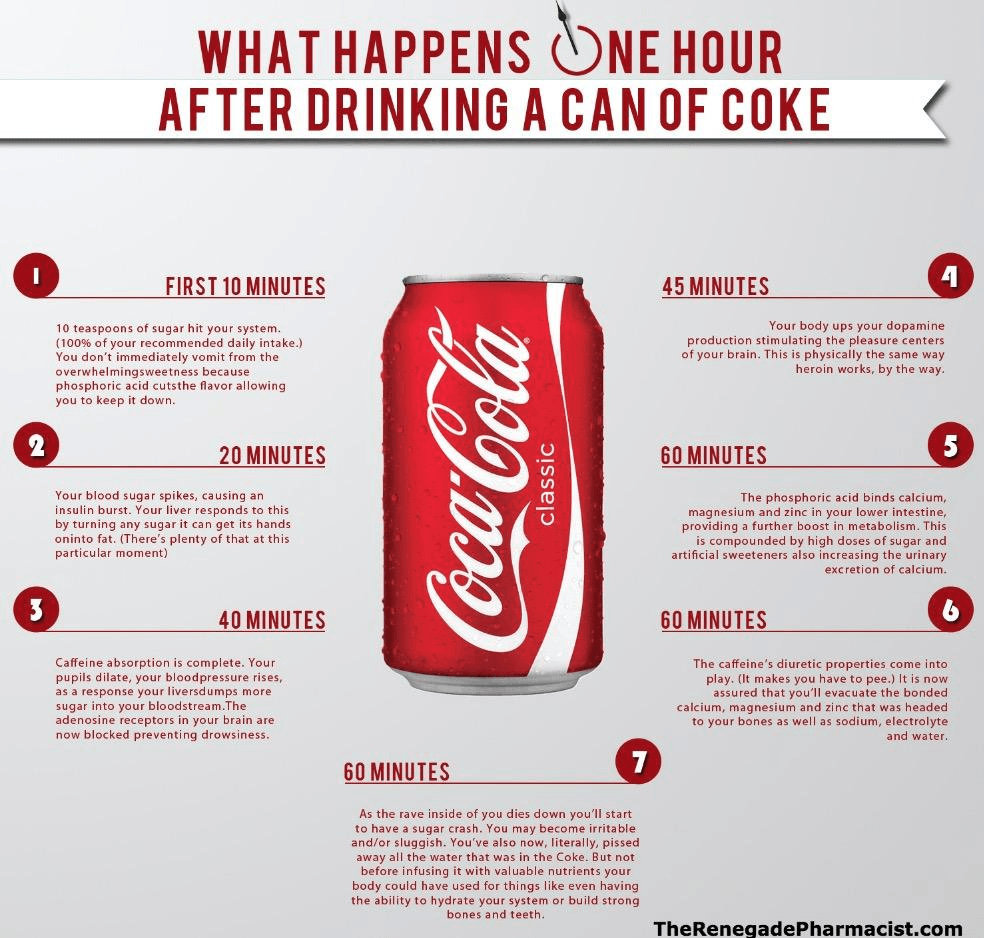
The results were so viral that even CBS News covered the infographic and Naik’s The Renegade Pharmacist site. That’s a truly spectacular achievement for a relatively obscure blog.
Here’s what made this infographic so shareworthy:
- It tackles a little-known subject many are interested in
- It addresses something everyone can relate to (drinking soda)
- It shocks readers by revealing some very unsettling information
- It gets right to the point in a no-frills-or-gimmicks sort of way
Dr. Joseph Mercola’s 10 Banned Foods That Every American Should Stop Eating
This is another great example of an infographic that hits home because it tackles a crucial aspect of everyone’s daily life: what they eat. Additionally, it uses fear to create a sense of urgency to get people to read the infographic.
Published a few years ago, this infographic on banned foods has a whopping 687.2 K shares across social media! In other words, it’s closing in on almost 1 million shares.

Like the other aforementioned examples, this perfect infographic does many things right. It features:
- A popular and easy reading flow, the so-called Z motion of absorbing content
- Vibrant and attractive colors
- A lot of numbers, facts and stats that people can remember
- Information that’s presented in point-blank fashion
- A good number of images to help break up the written information
How to Create the Perfect Infographic
Now that you know in detail what an infographic is all about and have seen a few examples of viral infographics that have made an impact on the web in the last few years, you’re hopefully more than convinced about their value as marketing tools.
With some planning, good design, and messaging prowess, you, too, can craft the perfect infographic to help your digital marketing arsenal.
Here are some common traits of infographics that have a great chance of going viral.
Start With the Headline
If you notice from our case studies above, they all have an enticing headline. The headlines variously:
- Ask important questions
- Are short and straight to the point
- Use numbers to communicate informational value

Clearly, having an attention-grabbing headline is where it all begins. To help you brainstorm a killer headline, use tools like CoSchedule’s Headline Analyzer, which scores your headline according to different, crucial factors.
Use Images and Illustrations
To say that people are visual creatures is an understatement; the human brain is designed to absorb information better when it see pictorial representations along with text and data. According to classic research on the effects of text illustrations, folks who follow directions that feature text and illustrations do a whopping 323% better than those following only text directions.

If you look at the infographic case studies above, you certainly see that all of them feature many images and/or illustrations. That’s because, from a readability and legibility viewpoint alone, images and illustrations act almost the way commas do in the written word, helping to break up chunks of information to make it easier to absorb for the audience.
Respect the Size of Your Infographic
Size matters when you’re creating the perfect infographic—getting the right size. According to research by visual-content tool Visme, choosing certain dimensions for your infographic helps to increase the number of shares it gets.

After poring through data to discover the median size of the best-performing infographics, Visme determined that those with a size of about 800 pixels by 2619 pixels were the top performers. Put another way, this equals an infographic that’s approximately three times longer than it is wide.
So keep that in mind when you’re planning out the content flow of your next infographic.
Use Storytelling to Tie It All Together
If you look at all of the viral infographics we explored earlier in this blog post, you’ll note how they all have an element of storytelling to them.
The infographic on infographics took readers on a journey from the fundamentals of an infographic to advice for going viral to stats on its popularity—and everything in between.
The Coke infographic told the story of how the human body reacts to Coke at different lengths of time after the beverage is consumed.

Finally, Dr. Mercola’s infographic is a cautionary tale that tells the story of banned foods, where they’re banned, and why they’re banned.
The point is that storytelling in infographics pulls the reader in…also drastically increasing their “shareability.”
Unleashing the Force of the Perfect Infographic
The perfect infographic is just waiting for your brand to create it and unleash it on the Internet. As you’ve seen, it’s very possible to create an informative, visually attractive, and entertaining piece of content that gets shared an outrageous number of times.
When surveys confirm that a plurality of marketers (41.5%) identify infographics as the type of content that produces the highest engagement, then you have to give some serious thought to putting time, money and strategy behind creating these viral-marketing sensations.
Hey, you never know! Yours could be the next infographic that gets close to 1 million shares on social media.